




The Monday development meeting starts the same way every week. Someone says lead volume is up, someone else says discovery day is “looking good,” and nobody can say how many candidates are actually likely to sign this quarter. A month later the board asks why sales are behind plan. Franchise sales pipeline metrics fix that. A short set of numbers, reviewed weekly, shows where candidates are stalling and what to change while there is still time to change it. This guide covers the metrics that matter, the benchmarks to compare against and how to run a weekly pipeline review that leads to signed agreements.
Key Takeaways
- Franchise sales pipeline metrics measure each stage, from lead to signed agreement, so you can see where candidates drop out.
- Lead-to-agreement conversion across 460+ brands in FranConnect’s data was just 1.50% in 2025, so small stage-by-stage gains matter a lot.
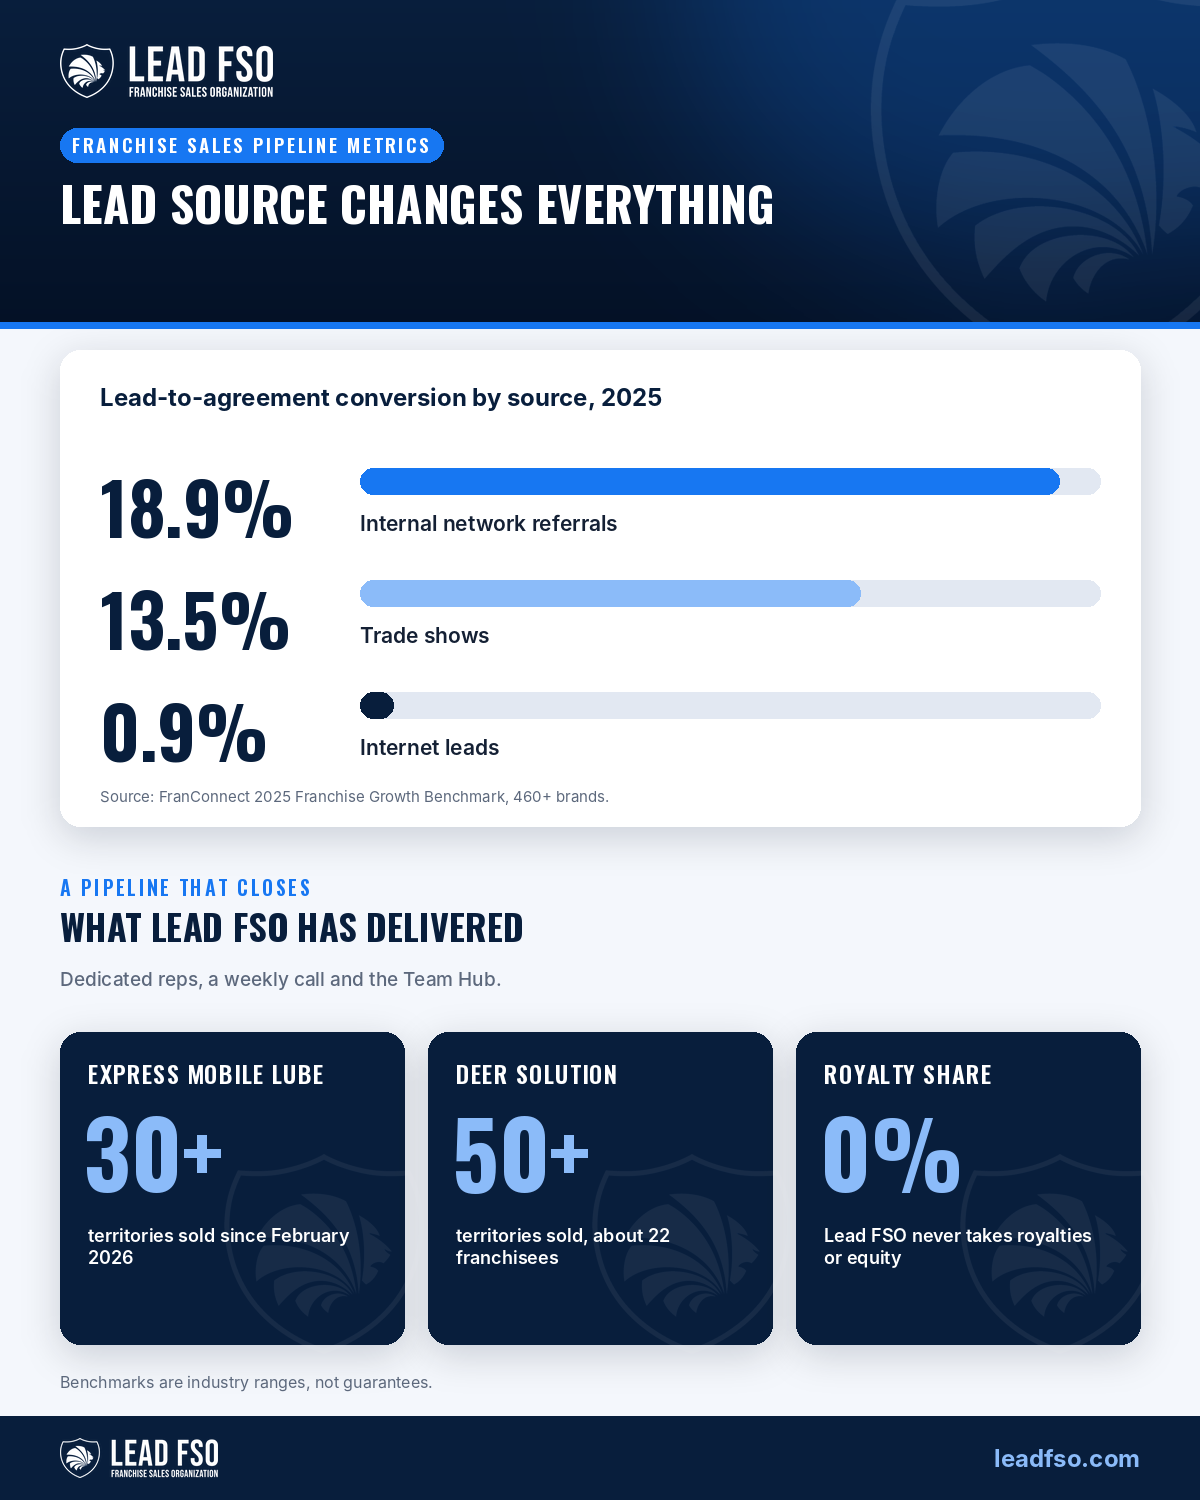
- Lead source changes everything: internal referrals converted at 18.9% and trade shows at 13.5%, against 0.9% for general internet leads.
- Track speed (first contact, time in stage) as closely as volume; slow follow-up is one of the most common ways leads are lost.
- Lead FSO’s dedicated reps run a weekly call with every client, built on the same pipeline numbers your team sees in the Team Hub.
Why Franchise Sales Pipeline Metrics Matter
Franchise sales is a long, multi-step process. A candidate moves from inquiry to first call, application, FDD delivery, validation, discovery day and finally a signed agreement. Each step loses people. If you only track leads in and deals out, you can’t tell whether the problem is lead quality, rep follow-up, your FDD or the discovery day.
The industry numbers show why this matters. FranConnect’s 2025 Franchise Growth Benchmark, built on data from more than 460 brands, put lead-to-agreement conversion at 0.76% in 2023, 0.96% in 2024 and 1.50% in 2025, on about 1.06 million tracked leads in 2025. When fewer than two in a hundred leads sign, a small improvement at any one stage changes your year.
The Core Franchise Sales Pipeline Metrics
Volume and quality
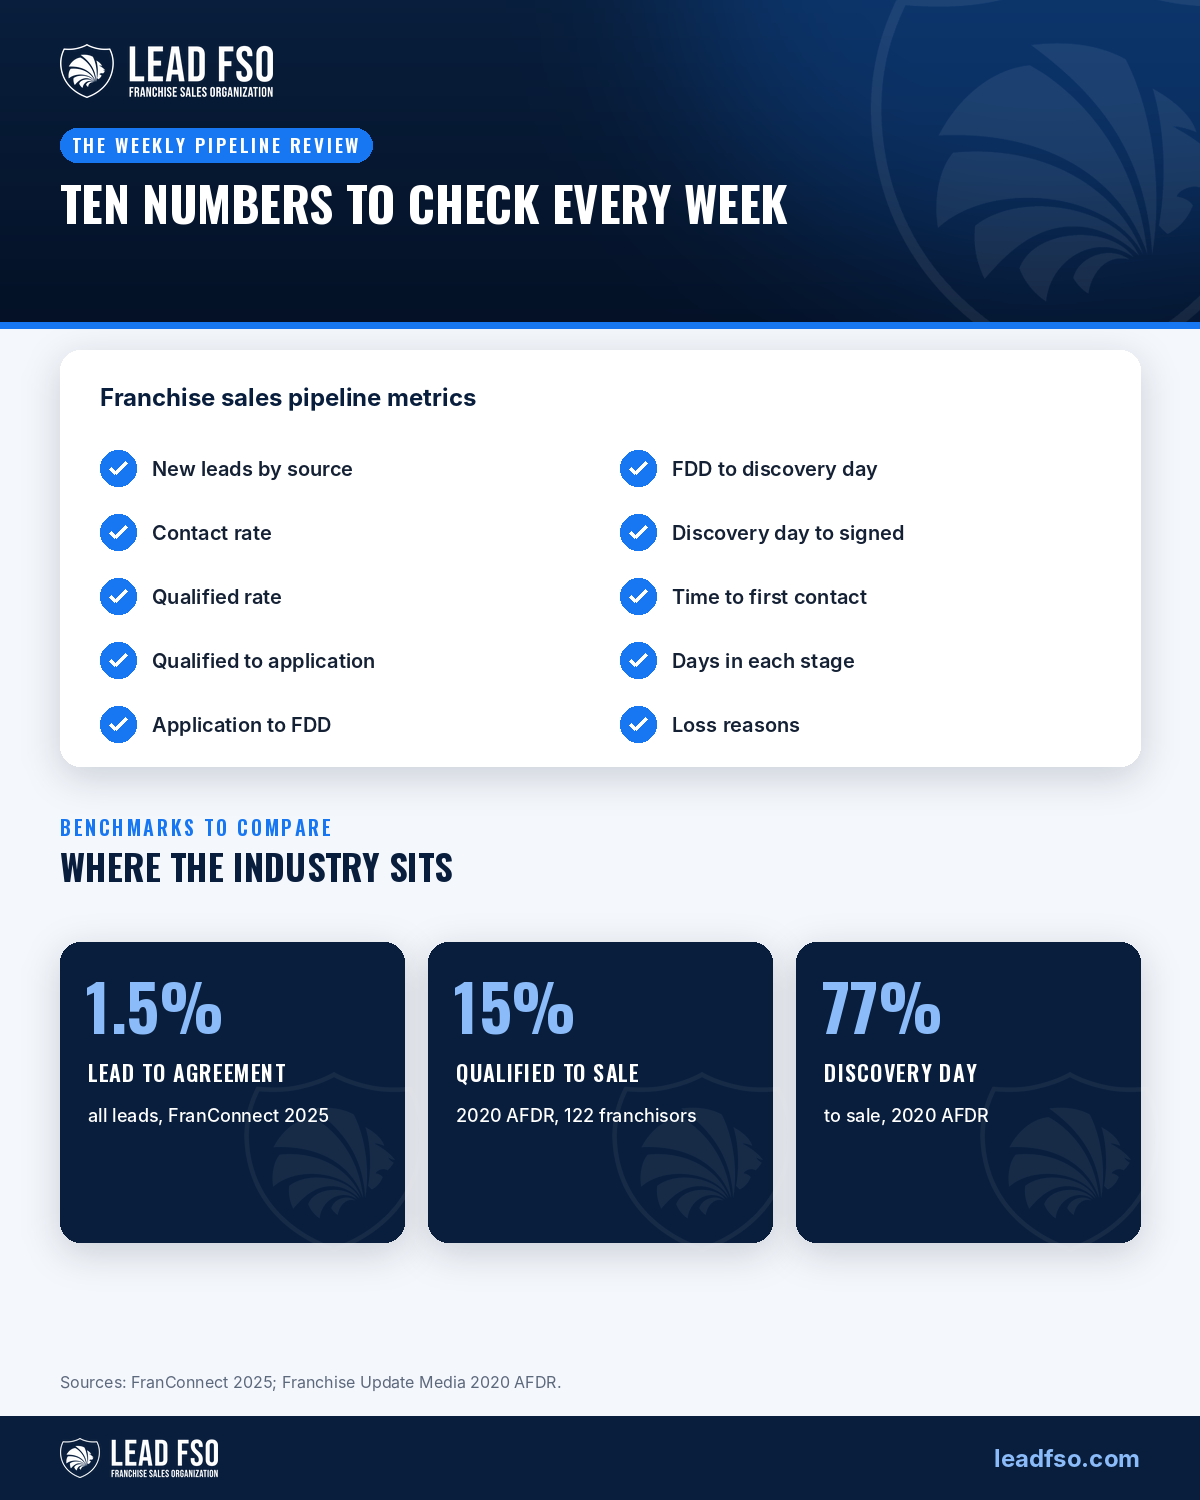
- New leads by source. Count them weekly, split by source: website, portals, brokers, trade shows, referrals, paid ads.
- Contact rate. The share of new leads your team actually reaches by phone or text.
- Qualified rate. The share that pass your candidate scorecard on liquid capital, net worth, timeline and fit.
Stage conversion
- Qualified lead to application.
- Application to FDD delivered.
- FDD to discovery day.
- Discovery day to signed agreement.
Speed
- Time to first contact. Measured in minutes or hours, not days. See our guide to franchise lead response time.
- Days in stage. How long candidates sit at each step. A rising number is the earliest warning that a deal is going cold.
- Lead-to-signing cycle time. The total days from first inquiry to signed agreement.
Outcome
- Signed agreements and territories sold against plan.
- Cost per signed agreement by source, once you have enough deals to measure it.
- Loss reasons. Why candidates left, in a fixed list your reps must choose from.
Benchmarks to Compare Your Pipeline Against
Franchise sales pipeline metrics only help when you compare them with something. Benchmarks differ because sources define stages differently, so use them as a range, not a target. Three useful sets come from FranConnect, Franchise Performance Group and the 2020 Annual Franchise Development Report:
| Stage | Benchmark | Source |
|---|---|---|
| All leads to signed agreement | 1.50% (2025) | FranConnect, 460+ brands |
| Overall lead to close | 1% to 2% | Franchise Performance Group |
| Leads contacted | About 50% | Franchise Performance Group |
| Leads qualified | 10% to 20% | Franchise Performance Group |
| Qualified leads to sale | 15% | 2020 AFDR (122 franchisors) |
| Applications to sale | 27.7% | 2020 AFDR |
| Discovery day to sale | 76.7% (AFDR); about 85% (FPG) | 2020 AFDR; Franchise Performance Group |
Lead source matters most. In FranConnect’s 2025 data, lead-to-agreement conversion was 18.9% for internal network referrals, 13.5% for trade shows, 3.9% for brokers, 0.9% for internet leads and 0.6% for franchise website leads. Category matters too: QSR converted at 2.81% and business services at 0.49%. Compare your numbers with brands that look like yours.
Running a Weekly Pipeline Review
A weekly review keeps your franchise sales pipeline metrics useful. Keep it to 30 minutes and the same agenda every week.
- Scorecard first. New leads by source, contact rate, qualified rate and signed agreements, against last week and the four-week average.
- Stuck deals. Every candidate who has sat in one stage longer than your normal range, with the next step and the date it will happen.
- Discovery day pipeline. Who is scheduled, who is confirmed and what each still needs to decide. Our discovery day agenda guide covers the follow-up.
- Losses. Every lost candidate with a reason code. FranConnect’s top reasons were unresponsive, not interested, financial qualification, territory unavailable and bad contact information.
- One change. Agree one thing to change this week, such as a faster first call, a new nurture email or a different broker, and check it next week.
Common Pipeline Problems and What the Metrics Show
- High lead volume, low contact rate. Follow-up is too slow or too thin. FPG recommends at least two calls and two texts within 72 hours.
- Good contact rate, few qualified. Your ads or portals are drawing the wrong audience. Look at spend by source before buying more leads.
- Applications that never reach discovery day. Candidates are stalling between FDD and validation. A clear candidate nurture plan and a scheduled Item 19 walk-through usually help.
- Discovery days that don’t close. The event or the offer needs work, or candidates arrive unqualified. With benchmarks near 75% to 85%, a low rate here stands out.
- Losses to “territory unavailable”. Your territory map and your marketing don’t match. Stop paying for leads in markets you can’t sell.
How Lead FSO Tracks and Moves Your Pipeline
Lead FSO is a full-funnel franchise sales organization. We generate our own leads, and your dedicated franchise development rep works them through to a signed agreement. Every client gets a weekly call built on the franchise sales pipeline metrics above, so you always know which candidates are moving and which are stuck.
Your team sees the same data in our Team Hub: the prospect pipeline, territory ledger and signed documents in one place. Candidates use the Territory Explorer to see open territories and build a package, which shortens the time between first call and decision. We don’t take a royalty share or equity in your brand.
The results are real. Express Mobile Lube has sold 30+ territories since starting with Lead FSO in February 2026, and Deer Solution has grown to about 22 franchisees and 50+ territories sold. Both started with one to three locations.
Frequently Asked Questions
What are franchise sales pipeline metrics?
They are the numbers that measure each stage of franchise sales, from new lead to signed agreement: lead volume by source, contact and qualified rates, stage-to-stage conversion, time in stage and signed agreements against plan.
What is a good lead-to-close rate in franchise sales?
Industry figures sit around 1% to 2% of all leads. FranConnect’s data on 460+ brands showed 1.50% lead-to-agreement conversion in 2025, and Franchise Performance Group cites 1% to 2%. Rates are much higher for qualified leads and referrals.
Which lead sources convert best for franchisors?
In FranConnect’s 2025 benchmark, internal network referrals converted at 18.9% and trade shows at 13.5%, compared with 3.9% for brokers, 0.9% for internet leads and 0.6% for franchise website leads.
How often should a franchisor review its sales pipeline?
Weekly. A short weekly review of the scorecard, stuck deals, upcoming discovery days and lost candidates catches problems while there is still time to fix them.
How does Lead FSO report on the franchise sales pipeline?
Each client has a dedicated rep and a weekly call built on pipeline numbers, and the client’s team can see the prospect pipeline, territories and signed documents in Lead FSO’s Team Hub at any time.
Need help? If your pipeline numbers are hard to pull or don’t add up to signed deals, talk to Lead FSO about a dedicated rep and a weekly pipeline call.
Need Help?
If you’re considering enhancing your franchise sales strategy and driving quality leads, reach out to us through our Contact Us form. Let’s explore how we can support your franchise’s growth.








One Comment